Interactive Data Visualization - Applications used to illuminate the environmental effects of the Syrian War
Ece Karaca
MFA Design Research and Development, 2018
Thesis Abstract:
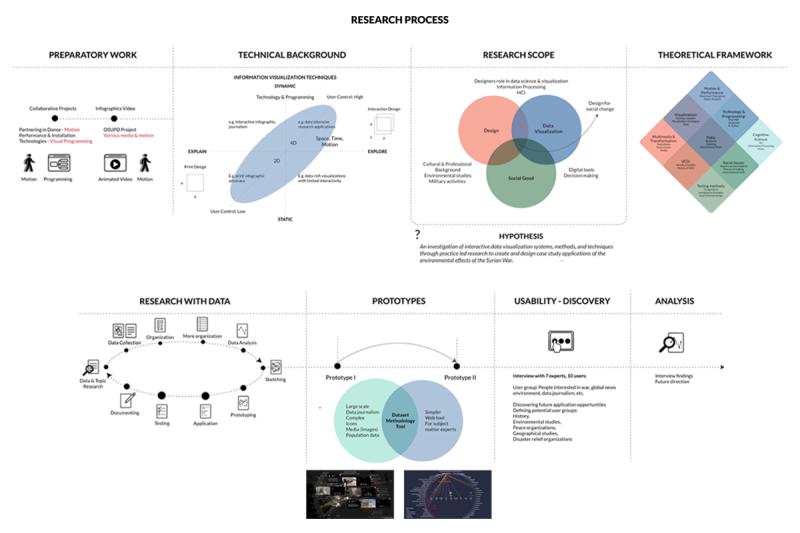
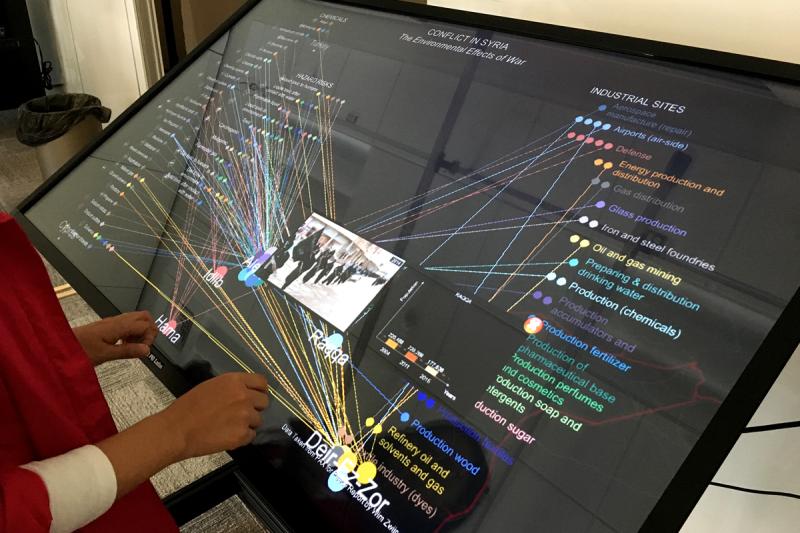
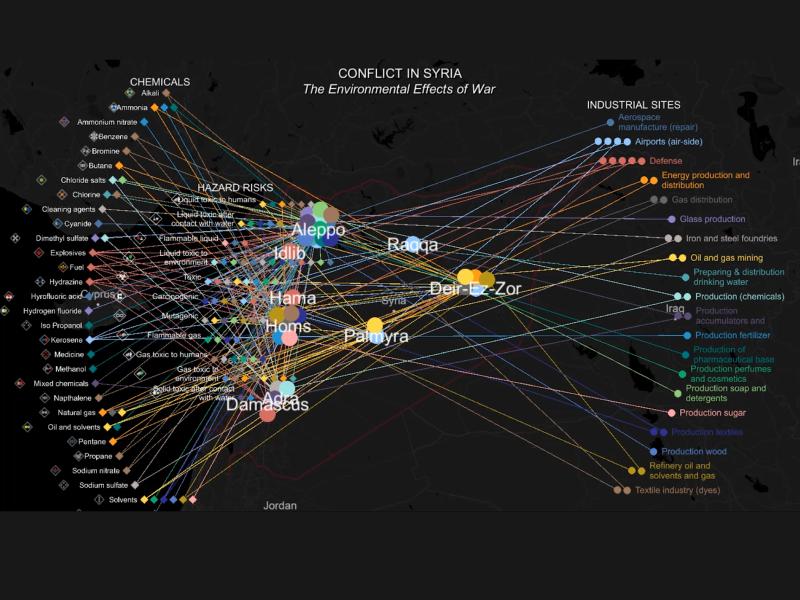
This research is a designerly investigation of interactive data visualization systems, methods, and techniques, guided by a practice-led research process, case study applications, and qualitative user research. Methods of creating effective data visualizations were practiced, to present multi-layered, complex information, with large applications.


Ece Karaca (“Ay-jay”) has a BFA degree in Graphic Design from Bilkent University, Ankara, Turkey. She is specializing in interactive data visualization and UX/UI design. Her creative research focuses on data visualization using interactive and digital tools to design systems that increases the understanding of multi-faceted, dynamic situations.
